![]()
![]()
Section 3.7 Special topic: Gas Jet Effects in Laser Cutting
We have given a literature review on gas jet effects in laser cutting in Level 1, Section 3.5. In this section we will give you a relatively complete idea of gas jet effects, then we will present some modeling work on gas jet.
Laser cutting with a C/W laser is a complex physical process and the number of variables that determine the quality of the end product should not be underestimated. Gas jet that removes the debris and molten material from the cut kerf is one of these important factors which is closely related with cutting quality and cutting speed.
Laser cutting can be preformed by focusing the laser beam near the surface of the workpiece with the simultaneous use of a coaxial or off-axis gas jet. A coaxial jet is concentric with the laser beam. The following figure shows some of the most commonly used coaxial nozzles.
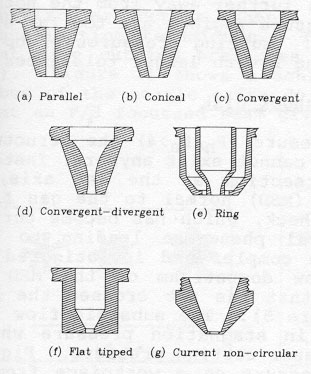
Figure 3.28 Commonly used coaxial nozzles (J. Fieret, et al., 1987)
Much data have been accumulated for laser cutting using various nozzle shapes with various stand off distances and pressures. But it appears to be little agreement on methods for obtaining a consistently high cutting quality. Usually the nozzle is positioned close to the workpiece (0.3-1.3 mm) and with low nozzle pressures. When higher nozzle pressure is used, the cutting speed is raised but the cutting repeatability can not be ensured.
In fact the cutting quality and process repeatability can be associated with the gas jet pressure that experienced by the workpiece. The work of Fieret et al, (1987) gave a good review on this topic. We have known that it helps to blow away the debris in laser cutting, the gas jet can be supersonic. When a reactive gas such as oxygen is used, it also delivers additional exothermic energy through chemical reaction between the assist gas and the molten material. Gas jet effects in laser cutting are really complex, but don't get overwhelmed, let's move on step by step!
1. Understand some aerodynamic phenomena in jets from coaxial nozzles
Cutting pressure is the gas jet pressure at the cutting kerf. A pressure transducer can be placed behind a pinhole in a disk simulating the workpiece, and the disk probe can be scanned along and transverse to the jet axis. Thus the distribution of the cutting pressure can be measured.
The most important aspect of a nozzle is that the gas flow exiting is supersonic or not. If the pressure applied to is exceeds a certain value
![]()
where Pn is the absolute pressure applied to the nozzle and Pa is the absolute ambient (usually refer to atmosphere) pressure, supersonic flow results. Supersonic flow from practical laser cutting nozzles is always under-expanded, which means that a shock structure exist in the jet. Figure 3.29 shows a free supersonic jet from a circular nozzle with Pn/Pa =3. The shock structure is caused by the sudden expansion of the gas flow at the edge of the nozzle, resulting in a conical shock. The conical shock starts at the nozzle edge and reflects many times on the jet boundary further downstream. The cutting pressure is associated with the stagnation pressure in the gas flow. Across the shock, the stagnation pressure always decreases.
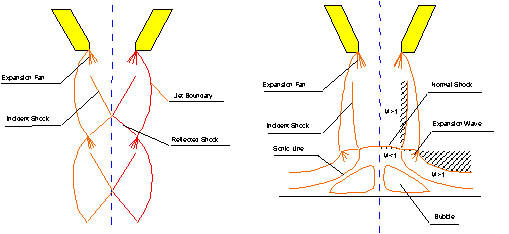
Figure 3.29 shows a free supersonic jet from a circular nozzle with Pn/Pa =3 (Left).
Thus the interaction of the shocks with the workpiece is closely related with the stand-off distance. Figure 3.30 shows a typical curve relating cutting pressure and stand-off distance. High cutting pressure is desired. The first region of high pressure is zone A and is very close to the nozzle tip. The small distance makes it vulnerable to damage by cutting debris and is not used in reality. The next high pressure region, zone B, lies further away from the nozzle tip. It is this region that should be used in practice, since it maintains a high cutting pressure and has a distance large enough to reduce the damage from debris. Other high pressure regions downstream are too far away for use with coaxial focussing optics with practical F-number.
Figure 3.30 A typical curve relating cutting pressure and stand-off distance
When higher nozzle pressure is used, i.e., when Pn/Pa > 4, the regular shock structure changes. A strong Mach shock disk (MSD) normal to the gas flow truncates the conical shock as shown in Figure 3.31. The flow downstream of the Mach shock disk is subsonic but the part of flow not passing through the MSD is still supersonic. In this case, the cutting pressure also varies with the standoff distance, but it is not periodic as in lower pressures, and the cutting pressure is lowest at the location of the MSD.
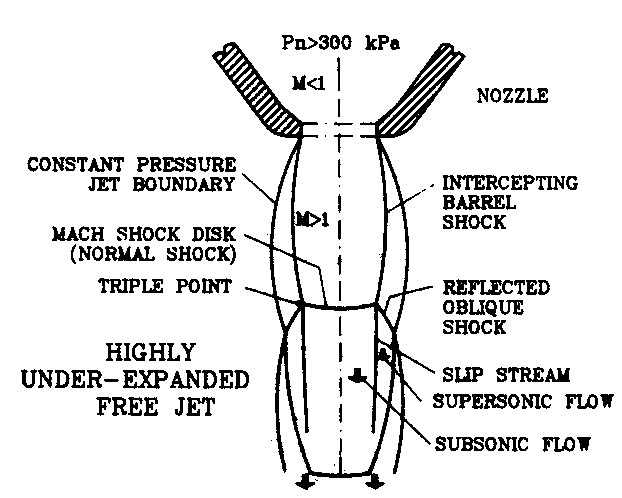
Figure 3.31 Illustration of Mach shock disk (MSD)
In summary, the cutting pressure of a circular coaxial nozzle is the function of nozzle pressure and stand-off distance. At nozzle pressure range 1.89 Pa < Pn < 4 Pa, cutting pressure shows periodic variations with the stand-off distance. Zone B is the practical distance used. At higher nozzle pressures, Mach shock disk appears. There is discontinuity in cutting pressure at the transition from Zone B to MSD. This transition point is very sensitive to minor damage or irregularities of the nozzle tip. This may cause unexpected irreproduceability problems.
The existance of a vortex ring or stagnation bubble in impinging jets with a MSD as shown in Figure 3.32. A stagnation bubble or vortex ring is a stable, toroidal body of rotating gas located between the MSD and the surface of the workpiece. Such vortex ring could result in ineffective debris removal and may also lead to plasma formation.
Figure 3.32 A vortex ring or stagnation bubble in impinging jets with a MSD (Right)
2. Other nozzle designs
It was expected that by breaking the symmetry of the circular nozzle shock structure in the cutting jet, the MSD could disappear. A large number of nozzles had been tried, and the final selection is the three lobed nozzle designs shown in Figure 3.33. Cutting pressures of 500-600kPa-gauge can be reached at a stand-off distance of 4.5-6.5mm.
Ring nozzle or annular nozzle is designed to influence the local ambient pressure around the central jet, thus the cutting pressure distribution of the central jet can be modified. The ring nozzle is shown in figure 3.34.
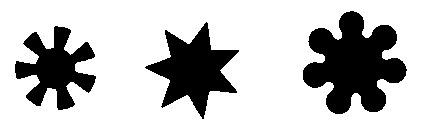
Figure 3.33 Lobed nozzles
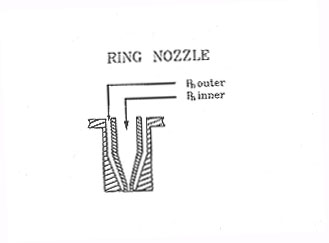
Figure 3.34 Ring nozzle (J. Fieret, et al., 1987)
Coanda nozzle (Figure 3.35) is similar to the ring nozzle except that the outside of the central nozzle has a round contour so that the gas on the streamlines that follow this contour is given a velocity component directed radially towards the center of the inner jet. Thus the central jet experiences a higher ambient pressure. Current coanda nozzles are capable of exerting a cutting pressure of 500 kPa-gauge at a stand-off of 4-5mm, the nozzle pressure in the inner nozzle being 700 kPa-gauge and in the outer 350kPz-gauge.
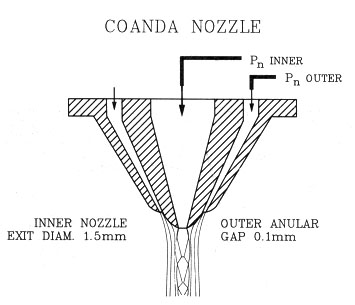
Figure 3.35 Coanda nozzle (J. Fieret, et al., 1987)
Tri-jet are used for very high power CO2 lasers. In this case there is an extended zone B but the cutting pressure is limited to relatively low values (200 kPa-gauge).
3. The effects of nozzle orientation
Aaron et al. studied the effect of nozzle orientation on the gas dynamics of inert-gas laser cutting of mild steel. They applied sonic and supersonic coaxial and off-axis nozzles to the cutting of mild steel sheet of 1 to 4 mm thickness. A 1 kW cw CO2 laser is used with nitrogen as the assist gas. Sonic coaxial cutting is compared to that of off-axis nozzles which vary in orientation from 20- 60 degrees behind the laser axis, and in exit Mach number from 1 to 2.4. Results show a 50% increase in maximum cutting speed at about a 40° nozzle angle. In comparison, variations in nozzle exit Mach number have little effect. A scale-model kerf was used to visualize the kerf gas dynamics, revealing that nozzle angles of 0-20° cause a shock wave/boundary layer interaction with flow separation inside the kerf. Angles of 20-45° alleviate this interaction, producing a uniform supersonic flow throughout the kerf which yields high cutting speeds due to high shear forces. For nozzle angles greater than 45° the assist gas is diverted away from the kerf, reducing cutting speed. Compared to nozzle angle, exit Mach number was found to be of secondary importance. The relation between nozzle angle and maximum cutting velocity is shown in figure 3.36.
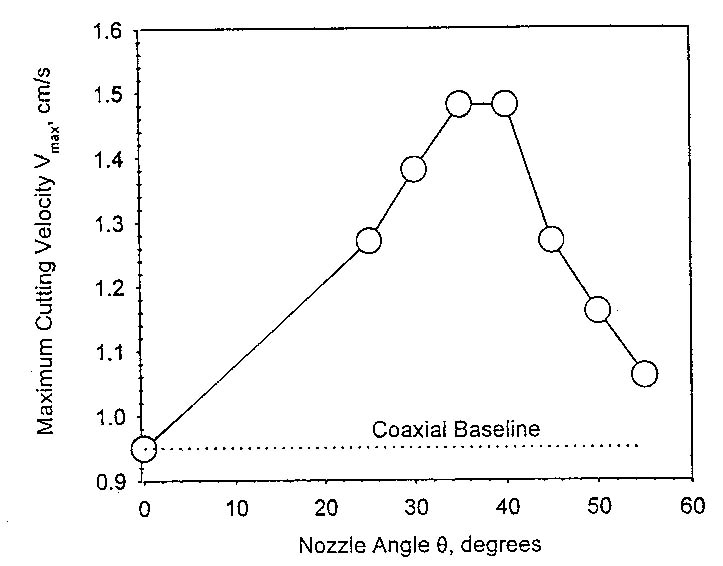
Figure 3.36 Vmax vs. Nozzle Angle for sonic exit nozzles (Aaron D. Brandt, et al. 1996)
4: Numerical studies of Gas Jet - Workpiece Interactions (Kai, 1998)
The efficiency and overall quality of laser machining is strongly dependent on the interaction of the gas jet with the workpiece. Continuing from level 1 section 3.5, we will introduce the modeling part of the Gas jet - workpiece interaction. The interaction of a gas jet with the workpiece in laser machining is investigated by systematically studying the influence of the processing parameters on the shock structure of the gas flow. The numerical simulation of a transonic, turbulent jet impinging on a plate (workpiece) with a hole concentric with the jet is presented, revealing the effects of gas pressure and nozzle standoff distance on shock structure.
In order to make the problem amenable to analysis while addressing the main goals of the study, the following assumptions are made:
A conical convergent nozzle is assumed to deliver a gas jet that normally impinges onto a workpiece plate with a through hole concentric with the nozzle (Figure 3.37). The through hole diameter d is assumed to be smaller than the exit diameter of nozzle D. The assumption of a through hole that is concentric with the nozzle makes the problem axisymmetric, thus reducing the dimensionality of the problem. Axisymmetric studies have significance not only because they corresponds to the laser drilling case, but because they also reveal the generic behavior of the gas flow upstream of the machining front. This flow behavior is expected to be relatively independent of the actual cut geometry.
Figure 3.37 Schematic of computational domain for simulation
The thermal interactions of the laser and the possibly reactive gas with workpiece material including melting and vaporization are not considered. In other words, the hole diameter is prescribed unlike a real machining process where the size of the hole or cut would be determined by the operating conditions. The gas flow structure and the mass flow rate through the hole are primarily determined by the total pressure upstream of the hole, while in turn is determined by the interaction between the nozzle, workpiece and gas flow.
Governing Equations
The flow is assumed to be governed by the steady compressible Reynolds-Averaged Navier-Stokes (RANS) equations. A commercial CFD code, RAMPANT is used for the numerical simulation. A two-equation turbulence model based on RNG theory is utilized (Yakhot & Orszag, 1986). In axisymmetric coordinates the RANS equations can be written as
![]() (*)
(*)
where (F, G) and (Fv, Gv) represent the inviscid and viscous flux terms respectively.
 ,
,  ,
,
 ,
, 
The stress terms in axisymmetric coordinates are
![]() ,
,
![]() ,
,
![]()
The effective viscosity m is
composed of the molecular viscosity m m
and the turbulent viscosity m t,
i.e. ![]() , and is assumed to
be:
, and is assumed to
be:
In order to obtain m and m t, a two-equation turbulence model for turbulent kinetic energy (k) and energy dissipation (e ) is applied. The transport equations for k and e derived from the RNG theory are:
![]() , (***)
, (***)
![]()
Quantity a is obtained from an analytical formula in the RNG theory:
where a 0 = 1.0.
S is the modulus of the mean strain rate tensor, that is ![]() ,
and Re is given by
,
and Re is given by
where ![]() ,
,
![]() and
and ![]() .
The model constants Cm , C1e
and C2e derived
analytically by the RNG theory are 0.0845, 1.42 and 1.58 respectively. In order
to take into account of the effects of compressibility, the k equation (Eq.
***) is modified as
.
The model constants Cm , C1e
and C2e derived
analytically by the RNG theory are 0.0845, 1.42 and 1.58 respectively. In order
to take into account of the effects of compressibility, the k equation (Eq.
***) is modified as
![]()
where Mt is the turbulent Mach number defined as
![]()
where a is the speed of sound.
The density and the total internal energy assuming ideal gas behavior are
![]() , and
, and
![]()
The equations and relationships outlined in the section provide a closed set of equations with the primary variables of r , p, u, v, k and e .
Numerical Scheme
The flow solver is an unstructured finite-volume code with the capability of adaptive grid refinement. The solver uses a semi-discrete finite-volume formulation, resulting in a consistent approximation to the conservation laws in integral form
![]()
Spatially discretized form of these equations is obtained by subdividing the physical domain into small cells and applying integral equations to each cell. The solution vector used to evaluate the fluxes at the cell faces is computed using a linear reconstruction approach with second-order accuracy. The discrete, inviscid flux vectors (F and G in Eq. (*)) are evaluated by flux difference splitting (Roe, 1986). The discretized equations are obtained by integrating the governing equations over each finite volume. Integration to steady state is carried out using a multi-stage Runge-Kutta scheme with multigrid convergence acceleration.
Nonequilibrium wall functions are used for near wall treatment
in conjunction with the RNG turbulence model. Nonequilirium wall functions extend
the applicability of the wall function approach by including the effects of
pressure gradient and strong nonequilibrium and hence are suitable for jet impingement.
Unstructured triangular grids were generated so that for the wall adjacent cells,
the cell dimension is about 30 y+ in wall units. Here y+
is defined as ![]() , where ut
is the local friction velocity and y the physical distance away from the wall.
Solution based grid refinements is carried out to the unstructured mesh wherever
there are large gradients in the solution variables.
, where ut
is the local friction velocity and y the physical distance away from the wall.
Solution based grid refinements is carried out to the unstructured mesh wherever
there are large gradients in the solution variables.
Boundary Conditions
Since the delivery nozzle is a convergent type and the flow at the nozzle exit is always choked for pressures of interest, our computational domain boundary is located at the nozzle exit plane. The flow at the nozzle exit is assumed to be uniform and at sonic conditions. Whereas this may cause some inaccuracies particularly close to the nozzle lip, it will not influence the flow characteristic downstream. Sonic conditions are enforced at the nozzle lip by specifying the total pressure and total temperature according to one-dimensional isentropic flow relations:
![]()
where the Mach number M is set to unity. At inlet boundaries the total pressure, static pressure, total temperature and the flow direction are imposed. At the subsonic outlet boundary, the static pressure is specified whereas the remaining flow properties are extrapolated. No-slip wall and symmetry boundary conditions are applied at the plate and the centerline respectively.
Experimental Setup
The experimental setup was designed to measure the mass flow rate through a predrilled hole in the workpiece with variation of total nozzle pressure and standoff distance. While the mass flow rate through the cut kerf may not be of concern in itself for laser machining, it is directly related to the total pressure at the machining front which in turn is an important factor in determining the material removal capability of the gas jet. The measurement of the mass flow rate also provides a convenient and viable verification of the simulation results. Considering the small physical dimension of the actual laser kerf, field measurement of the flow would be very difficult.
A schematic of the experimental setup is shown in Figure 3.38.
A commercial sonic (converging-only) nozzle with a nozzle diameter D
of 1.35mm is used. Compressed air from a gas tank is fed into the nozzle through
a gas inlet where a pressure gauge was set. The gas pressure can be adjusted
through a regulator installed upstream of the gas inlet. The gas exiting the
nozzle impinges on an plate (or workpiece) with a predrilled hole in it. The
impingement plate is 1.5mm thick with two through holes (with diameters 0.508mm
or 0.711mm). The nozzle flow ![]() is in part deflected by the plate. The remaining flow, through hole flow
is in part deflected by the plate. The remaining flow, through hole flow ![]() enters the hole. The small hole diameter and the high gas speeds make it difficult
to measure the through flow. Hence a collection box is placed directly underneath
to collect the flow and direct it to a 10mm measurement nozzle (area Am
= 78.5 mm2) at considerably lower flow speed. The impingement plate
along with the collection box are placed on a precision x-y table to allow alignment
of the hole with the delivery nozzle. A micrometer is used to obtain a precise
measurement of the stand-off distance. The velocity of the gas leaving the measurement
nozzle (Vm) is then measured using a hot-film anemometer (TSI
8350). The hot-film probe is placed directly underneath the measurement nozzle
exit by another positioning system for accurate centering. The measurement nozzle
contour guarantees that the velocity profile of the gas steam is nearly uniform.
The density of the gas leaving the measurement nozzle r
m is assumed to be that of an ideal gas at ambient conditions. The
mass flow rate through the measurement nozzle (r
m, Am, Vm) and hence the through hole flow
enters the hole. The small hole diameter and the high gas speeds make it difficult
to measure the through flow. Hence a collection box is placed directly underneath
to collect the flow and direct it to a 10mm measurement nozzle (area Am
= 78.5 mm2) at considerably lower flow speed. The impingement plate
along with the collection box are placed on a precision x-y table to allow alignment
of the hole with the delivery nozzle. A micrometer is used to obtain a precise
measurement of the stand-off distance. The velocity of the gas leaving the measurement
nozzle (Vm) is then measured using a hot-film anemometer (TSI
8350). The hot-film probe is placed directly underneath the measurement nozzle
exit by another positioning system for accurate centering. The measurement nozzle
contour guarantees that the velocity profile of the gas steam is nearly uniform.
The density of the gas leaving the measurement nozzle r
m is assumed to be that of an ideal gas at ambient conditions. The
mass flow rate through the measurement nozzle (r
m, Am, Vm) and hence the through hole flow
![]() is obtained. The whole
apparatus for the measurement of through-hole mass flow rate is shown in Figure
3.39.
is obtained. The whole
apparatus for the measurement of through-hole mass flow rate is shown in Figure
3.39.
Figure 3.38 Schematic of experiment setup
Figure 3.39 The apparatus for the measurement of through-hole mass flow rate
Since the flow at the throat of the delivery nozzle is always
choked, it is possible to relate the upstream total pressure pt to
the mass flow rate from nozzle ![]() .
The following relationship holds at the sonic nozzle exit
.
The following relationship holds at the sonic nozzle exit
where ![]() . Pe
is the total gauge pressure at the nozzle exit, Pa is the
ambient pressure and A is area at the nozzle exit. The total pressure thus can
be obtained by knowing the mass flow rate from the sonic nozzle. In the above
relationship, the mass flow rate is corrected for viscous losses using a nozzle
discharge coefficient cD. The coefficient cD
is estimated to be 0.988 based on nozzle-throat Reynolds number for the nozzle
used here (Stratford, 1964).
. Pe
is the total gauge pressure at the nozzle exit, Pa is the
ambient pressure and A is area at the nozzle exit. The total pressure thus can
be obtained by knowing the mass flow rate from the sonic nozzle. In the above
relationship, the mass flow rate is corrected for viscous losses using a nozzle
discharge coefficient cD. The coefficient cD
is estimated to be 0.988 based on nozzle-throat Reynolds number for the nozzle
used here (Stratford, 1964).
The same experimental apparatus was used to measure the mass flow rate from the sonic nozzle. The collection box however was raised to let the delivery nozzle lip stick into the box and the gap was sealed to prevent leakage. Thus the mass flow rate from the sonic nozzle can be obtained in the same manner as described before.
Experiments
The objective of the experimental part of this study was to
determine the effects of hole diameter d, standoff distance H and total pressure
pt on the hole through flow ![]() .
Two sets of measurements were carried. For Group 1 experiments, the total gauge
pressure at nozzle exit Pe was varied continuously between 120 kPa
and 490 kPa for d = 0.711 and 0.508 mm, and for standoff distance H
= 1.0, 1.5 and 2.0mm. For Group 2 experiments however, three distinct values
of Pe were chosen and H was varied continuously from 0 to 3.5mm for
d = 0.711 and 0.508mm. The above described conditions are summarized
in the following table:
.
Two sets of measurements were carried. For Group 1 experiments, the total gauge
pressure at nozzle exit Pe was varied continuously between 120 kPa
and 490 kPa for d = 0.711 and 0.508 mm, and for standoff distance H
= 1.0, 1.5 and 2.0mm. For Group 2 experiments however, three distinct values
of Pe were chosen and H was varied continuously from 0 to 3.5mm for
d = 0.711 and 0.508mm. The above described conditions are summarized
in the following table:
|
d (mm) |
H (mm) |
Pe (kPa) |
||||||||
|
Group 1 |
0.711 |
0.508 |
1.0 |
1.5 |
2.0 |
Varied From 120 to 490 |
||||
|
Group 2 |
0.711 |
0.508 |
Varied From 0 to 3.5 |
125 |
243 |
363 |
||||
Simulation Results and Discussions
Flow behavior within the hole as well as ![]() are essentially determined by the total gas pressure immediately upstream of
the hole. This pressure is nearly equal to the total pressure downstream of
the normal standoff shock. It is desirable to minimize the total pressure loss
through the normal shock. This can be achieved by changing the shock structure,
as will be shown by the simulation results. The simulations were carried out
over the computational domain for the same operating pressure conditions as
the experiments.
are essentially determined by the total gas pressure immediately upstream of
the hole. This pressure is nearly equal to the total pressure downstream of
the normal standoff shock. It is desirable to minimize the total pressure loss
through the normal shock. This can be achieved by changing the shock structure,
as will be shown by the simulation results. The simulations were carried out
over the computational domain for the same operating pressure conditions as
the experiments.
The velocity field across the hole is integrated to obtain
a computed value of ![]() . The
variations of the computed and measured
. The
variations of the computed and measured ![]() with Pe are shown in Figure 3.40. The computed results follow the
trends in the experimental results closely and capture the local maximum/minimum
in
with Pe are shown in Figure 3.40. The computed results follow the
trends in the experimental results closely and capture the local maximum/minimum
in ![]() for H = 2mm.
The experimental uncertainties in the measurements are shown as error bars in
Figure 3.40. The variation in the computed and measured
for H = 2mm.
The experimental uncertainties in the measurements are shown as error bars in
Figure 3.40. The variation in the computed and measured ![]() with
H is shown in Figure 3.41. Once again the unique behavior of
with
H is shown in Figure 3.41. Once again the unique behavior of ![]() at a critical standoff distance is captured by the numerical simulations.
at a critical standoff distance is captured by the numerical simulations.
Figure 3.40 Computed and measured through-hole mass flow rate for d = 0.711mm
Figure 3.41 Computed and measured through hole mass flow rate for d = 0.711mm
To further understand the particular phenomena seen in Figure 3.40, contours of static pressure at two different nozzle pressure levels for H = 2mm and d = 0.711mm are shown in Figure 3.42. The objective of Figure 3.42 is to reveal the changes in shock structure for Pe = 207 kPa (to the left of the local maximum) and Pe = 276 kPa (to the right of the local maximum). The oblique and the normal standoff shocks are similar to those of a gas jet impinging on a flat plate.
Figure 3.42 (a) Contour of static pressure for Pe = 207 kPa (d = 0.711mm, H = 2mm)
Figure 3.42 (b) Contour of static pressure for Pe = 276 kPa (d = 0.711mm, H = 2mm)
At the lower Pe of 207 kPa in Figure 3.42(a), the oblique shock has a larger deflection angle as expected from the theory of oblique shock waves (Oosthuizen and Carscallen, 1997). The incident shock waves meet at the centerline and are reflected prior to interacting with the normal standoff shock. In this case, the total pressure decrease downstream of the normal standoff shock is not large. At a higher Pe of 276 kPa in Figures 3.42(b), the incident shock waves have a smaller deflection angle thus preventing them to meet and reflect before interacting with the normal standoff shock. In this case, the total pressure decreases dramatically downstream of the normal standoff shock.
As Abbett (1971) points out, a normal shock is formed due to a strong compression process when the flow traverses from subsonic to supersonic region. The strength of the normal shock is related to the extent of the compression. Regular reflection of the oblique shock from the axis may result in a static pressure rise large enough so that additional compression is not significant. In this case, the normal shock is weak. On the contrary, if the oblique shock directly interacts with the normal shock, significant compression is needed in order to establish the pressure necessary for the subsonic region. In that case, the normal shock is much stronger. The corresponding total pressure loss as flow crosses the normal shock is large if the shock strength is high, and small if low.
It is not surprising that the total pressure at which the incident shock waves meet the centerline (about 225 kPa) and touch the standoff shock corresponds to the a local maximum in Figure 3.45 for H = 2mm. Beyond that critical point, the mass flow rate decreases in spite of increasing gas pressure because of the total pressure loss. The reason that the decrease is gradual instead of a sudden drop at a single Pe is due to the expansion of the normal standoff shock once the oblique shock directly interacts with the standoff shock, resulting in decreased shock strength. A slight increase of the nozzle pressure will increase the standoff shock strength and the loss of the total pressure. Thus the total pressure after standoff shock will decrease until the nozzle pressure is high enough to offset the pressure loss. For the case of small H (e.g., 1mm), the oblique shock always interacts with the standoff shock directly and therefore the total pressure after the standoff shock increases with the nozzle pressure and the through-hole mass flow rate always increases with the nozzle pressure.
The aforementioned explanation is confirmed by the axial variation of total pressure shown in Figure 3.43 for different nozzle pressures. The total pressure loss at higher nozzle pressures is so large that in fact the total pressure downstream of the standoff shock for a Pe of 276 kPa is less than that for a lower Pe of 258 kPa. The loss increases even further with Pe so that the total pressure downstream of the standoff shock for Pe = 345 kPa is nearly the same as that for Pe of 276 kPa.
Figure 3.43 Computed total pressure variation along the centerline for H = 2.0 mm and d = 0.711mm
Figures 3.44 (a) and (b) show the contours of static pressure
for H = 2 and 3.25mm, corresponding to two standoff distances before
and after the jump in ![]() seen in Figure 3.45 with Pe of 363 kPa. Once again, the differences
in shock structure between two pictures are distinguishable.
seen in Figure 3.45 with Pe of 363 kPa. Once again, the differences
in shock structure between two pictures are distinguishable.
In Figure 44 (a) (H = 2.0 mm), the incident shock interacts with the normal standoff shock directly. For low values of H, the through-hole mass flow rate decreases as the standoff distance increases as long as the incident shock directly meets the standoff shock.
Figure 3.44 (a) Contour of static pressure for H = 2mm (d = 0.711mm, Pe = 363 kPa)
Figure 3.44 (b) Contour of static pressure for H = 3.25mm (d = 0.711mm, Pe = 363 kPa)
However, when the standoff distance reaches a point where the incident shock waves first meet at the centerline before they reflect and interact with the normal shock, the loss of total pressure is greatly reduced, which results in a jump of the through-hole mass flow rate. This sudden jump in mass flow rate at higher gas pressures is due to a change in shock structure associated with high shock strength. It should be noted that as the gas pressure increases, the normal standoff shock will become a very strong normal shock disk and the incident oblique shock changes to a barrel shock.
In most laser machining cases, the nozzle standoff distance is chosen to be 0.5mm-1.5mm, thus the incident shock will always interact with the standoff shock directly. However, this study reveals that some favorable operating conditions do exist for large nozzle standoff distances within a certain range of the nozzle pressure. In those situations, the reflected shock is produced and interacts with the standoff shock, which has a higher total pressure downstream of the standoff shock. The nozzle pressure should be chosen to avoid direct contact between the incident shock and the standoff shock for large nozzle standoff distances.
The low total pressure after the standoff shock is associated with fluctuations of the pressure gradient and shear stress inside the hole. Figure 3.45 and Figure 3.46 show the static pressure gradient and the shear force inside the hole for four different conditions. The pressure and shear force have the same order if the pressure gradient is multiplied by the molten layer thickness which is at the order of 10-5m. Large fluctuations in the pressure gradient and the shear force for Pe = 276 kPa and H = 2mm corresponds to a characteristic behavior of that shown in Figure 3.42 (b), where the incident shock has direct contact with the normal standoff shock. Since the pressure gradient and the shear force are two driving forces in melt removal, the fluctuation has detrimental effects on the removal capability of the gas jet, which often results in poorer cut quality.
Figure 3.45 Static pressure gradient inside hole
Figure 3.46 Shear force inside hole
5. Laser cutting quality and gas jet effects
To verify the gas jet effects on laser cutting quality, laser cutting experiments were carried out under the same conditions as those of model kerf experiments. A PRC-1500 CO2 laser with maximum output 1.5kW, operated in CW and TEM00 modes was used for cutting experiments. The material being cut was cold-rolled mild steel of 1.6 mm thickness which has the same thickness as the impingement plate in the through-hole amd model kerf experiments for mass flow rate studies. In Group-1 experiments, air was used as assist gas for cutting, the gas pressure, Pe was fixed at 363 kPa and the nozzle standoff distance, H was varied. In Group-2 experiments, oxygen was used for cutting, H was fixed at 2.0 mm and Pe was varied from 122 kPa to 443 kPa which is the typical pressure range for oxygen assisted cutting of mild steels. Each group consisted of two experimental runs under the same conditions. These operating conditions given by gas pressure and standoff are identical to the conditions under which the through-slot and throgh-kerf mass flow rates were measured. To show their effects on cut quality most distinctively, the laser power and cutting speed were adjusted so that some samples were either barely cut through or not through at all. The laser cutting parameters for Goup-1 and Group-2 experiments are listed in the following table:
|
|
Assist Gas |
Gas Pressure |
Standoff |
Laser Power |
Cut Speed |
|
Group 1 |
Air |
363 kPa |
Varied |
800 W |
35 mm/s |
|
Group 2 |
Oxygen |
Varied |
2.0 mm |
200 W |
40 mm/s |
a) H = 1.0 mm b) H = 1.5 mm
c) H = 3.0 mm d) H =3.5 mm
Fig. 3.47 SEM of dross attachment on cut surface with different standoff at Pe = 363 kPa (incomplete cuts for H = 2.0 and 2.5mm)
In Group-1 experiments, the less oxidized iron in the air assisted cutting has much higher viscosity and surface tension than the oxide-rich melt in oxygen assisted cutting (Ivarson, et al.), and hence it is harder to eject the melt. Depending on the removal capability of the gas jet, resolidified melt (dross) may cling to the bottom edge of the cut kerf.
It is expected that more dross will be attached to the edge, when the ejecting force exerted by the gas jet is weak, and vice versa. Fig. 3.47 shows the dross attachment on cut edge with 4 different standoffs in the first run of the experiments. Dross was observed at H = 1.0 mm. The amount of dross increases for H = 1.5 mm. Cuts were incomplete at H = 2.0 and 2.5 mm which is equivalent to extremely severe dross attachment. The dross attachment then suddenly decreases to a minimum amount at H = 3.0 mm, and it increases slightly at H = 3.5 mm. If the variation of dross attachment with standoff is compared with the variation of through-slot mass flow rate, it is seen that they exhibit opposite patterns. The sudden decrease in the dross corresponds to the jump of the through-hole mass flow rate. It is easy to understand this correspondence because the through-kerf mass flow rate has similar trends as the shear stress and pressure gradient, the two forces responsible for melt removal. So this study fundamentally explains why the total gas pressure and standoff have direct impact on the cut quality.
Each cut kerf in group-1 experiments was cross-sectioned and examined under SEM. Because of higher viscosity and surface tension associated with unoxidized molten iron, it is normally not all ejected from the cut zone in such inert-gas assisted cutting. The melt not ejected from the cut zone will resolidify on the cut surface and form a recast layer. The thickness of the recast layer varies depending on the removal capability of the gas jet, the larger the removal capability, the thinner the recast layer, and vice versa. Fig. 3.48 shows SEM pictures of the recast layer on the surface of the cut kerf of each sample from the second run. The recast layer increases as H increases from 1.0 to 1.5 mm, and then decreases to a minimum value at H = 3.0 mm and again increasing slightly at H = 3.5 mm. If the cases of incomplete cuts at H = 2.0 and 2.5 mm are considered to be equivalent to the maximum recast layer, the pattern of change of the recast layer thickness with standoff is similar to that of dross attachment.
a) H = 1.0 mm b) H = 1.5 mm
c) H = 3.0 mm d) H =3.5 mm
Fig. 3.48 SEM of recast layer on cut surface with different standoff at Pe = 363 kPa (incomplete cuts for H = 2.0 and 2.5mm)
In Group-2 experiments, the samples were not cut through for Pe = 323 kPa, 363 kPa in the first run, and not cut through for Pe = 122 kPa, 363 kPa in the second run. SEM pictures of the cut kerf from the second run are shown in Fig. 3.49. On the upper portion of the cut kerf, regular striations are seen. Their formation involves more complicated physics and is studied by many researchers. On the lower portion of the cut kerf, there is a small amount of dross attached along the bottom edge, which indicates the melt is ejected from there. The surface finish of the lower portion is therefore more directly influenced by the ejecting forces of shear and pressure gradient associated with the gas jet. As seen, the surface finish at Pe = 283 kPa is better than those at Pe = 162 kPa and Pe = 403 kPa.
Fig. 3.49 SEM measurements of cut surface with different gas pressure at 2.0mm standoff (incomplete cuts at Pe = 323 kPa, Pe = 363 kPa)
Fig. 3.50 Roughness (Ra) measurement at low portion of cut surface and through-slot mass flow rate measurement with different gas pressure at H = 2.0mm
Fig. 3.50 shows the roughness Ra (root-mean-square average) of the lower portion of the cut vs. gas pressure at standoff H = 2.0 mm. It also shows the through-slot mass flow rate measurement. The situations where cuts are incomplete are marked with a triangle at the top of the figure to indicate they correspond to the maximum roughness. As seen, the roughness decreases as Pe increases to about 300 kPa, before the cut becomes incomplete at Pe = 323 kPa, Ra then decreases again as Pe increases further. Comparing the variation of the roughness with the variation of the through-slot mass flow rate shown in the same figure, it is seen that the roughness follows a trend opposite to that of the through-slot mass flow rate. It is thus seen that a higher through-kerf mass flow rate corresponding to higher shear stress and pressure gradient results in better surface finish, whereas a lower through-kerf mass flow rate gives poor cut quality. The sudden drop of the mass flow rate with gas pressure for a standoff of H = 2 mm is due to the aforementioned change of the shock structures upstream of the workpiece.
Concluding remarks
The interaction of a gas jet with the workpiece in laser machining is investigated by systematically studying the influence of the processing parameters on the shock structure of the gas flow. The numerical simulation of a transonic, turbulent jet impinging on a plate (workpiece) with a hole concentric with the jet is presented, revealing the effects of gas pressure and nozzle standoff distance on shock structure. Experimental measurements of the mass flow rate through the hole under conditions corresponding to those of the simulation were carried out. Experimental data are found to match the simulation results. It is found that certain favorable operating conditions exist under which the oblique incident shock waves merges on the centerline and reflect before interacting with the normal standoff shock. In those cases, the total pressure loss across the standoff shock is less and a high total pressure remains at the machining front. The direct interaction of the incident waves and the normal standoff shock results in a large reduction of the total pressure across the standoff shock, conditions unfavorable to laser machining. In addition, the pressure gradient and shear force fluctuate at the machining front, reducing the removal capability of the gas jet and resulting in a poorer surface finish.
References
Aaron D. Brandt, et al., 1996, "Effect of nozzle orientation on the gas dynamics of inert-gas laser cutting of mild steel," ICALEO 1996, Section C, pp.10-19.
Gabzdyl, J.T.; Morgan, D.A., 1992,"Assist gases for laser cutting of steels," ICALEO Oct 25-29 1992 pp. 443-447
Horisawa, Hideyuki; Fushimi, Takashi; Takasaki, Takuya; Yamaguchi, Shigeru, "Flow characterization in a laser cut kerf ," CLEO/PACIFIC Rim '99) Aug 30-Sep 3 1999 v2 1999, pp. 358-359
Hsu, M.J.; Molian, P.A., 1995, "Off-axial, gas-jet-assisted, laser cutting of 6.35-mm thick stainless steel," Journal of Engineering for Industry, Transactions of the ASME v117 n2 May 1995, pp. 272-276
Ilavarasan, P.M.; Molian, P.A., "Laser cutting of thick sectioned steels using gas flow impingement on the erosion front," Journal of Laser Applications v7 n4 Dec 1995, pp. 199-209
J. Fieret, et al., 1987, "Overview of flow dynamics in gas-assisted laser cutting," SPIE, High Power Lasers, Vol. 801, pp. 243-250.
Kai Chen, 1998, Ph.D. thesis, Chapter 4, Columbia University, Dept. of M.E.
Kai Chen, Y. Lawrence Yao and Vijay Modi, 2000, "Gas jet-workpiece interactions in laser machining," Journal of Manufacturing Science and Engineering, Aug. 2000, Vol. 122, pp.429-438.
Lim, C.K.; Molian, P.A.; Brown, R.C.; Prusa, J.M., 1998, "Numerical studies of gas jet/molten layer interaction during laser cutting," Journal of Manufacturing Science and Engineering, Transactions of the ASME v 120 n 3 Aug 1998 pp. 496-503
Man, H.C.; Duan, J.; Yue, T.M., 1996, "Design and characteristic analysis of supersonic nozzles for high gas pressure laser cutting ,"Journal of Materials Processing Technology Proceedings of 1996 3rd Asia Pacific Conference on Materials Processing, Nov. 12-14 1996, v 63 n 1-3, pp. 217-222
Man, H.C.; Duan, J. and Yue, T.M., 1999, "Analysis of the dynamic characteristics of gas flow inside a laser cut kerf under high cut-assist gas pressure," Journal of Physics D: Applied Physics v 32 n 13 1999, pp. 1469-1477
O'Neill, W.; Steen, W.M., 1995, "Three-dimensional analysis of gas entrainment operating during the laser-cutting process," Journal of Physics D: Applied Physics v28 n1 Jan 14 1995, pp. 12-18
O'Neill, W.; Gabzdyl, J.T.; Steen, W.M., 1992,"Dynamical behaviour of gas jets in laser cutting," Proceedings of SPIE - The International Society for Optical Engineering ICALEO Laser Materials Processing Oct 25-29 1992 v 1990 1993 Orlando, FL, , USA, pp. 449-458
Powell, J.; Ivarson, A.; Kamalu, J.; Broden, G.; Magnusson, C., 1992, "Role of oxygen purity in laser cutting of mild steel," ICALEO 1992, pp. 433-442
Tong, Kwok-On, 1997,"Analytical model for laser fusion cutting of metals," ICALEO'97. Part 2 (of 2) Nov 17-20 1997 v 83 n 2 1997 San Diego, CA, , USA, Sponsored by : LIA Laser Inst of America Orlando FL USA p E128-E137
Weingartner, W.; Kaplan, A.; Schuocker, D., 1996, "Laser machining with melt removal through suction," International Journal of Materials & Product Technology v11 n3-4 1996, pp. 310-319
Yilbas, B.S.; Davies, R.; Gorur, A.; Yilbas, Z.; Begh, F.; Akcakoyun, N.; Kalkat, M., 1992,"Investigation into the development of liquid layer and formation of surface plasma during CO2 laser cutting process," Proceedings of the Institution of Mechanical Engineers, Part B: Journal of Engineering Manufacture v 206 n B4 1992 pp. 287-298
Yilbas, B.S.; Kar, A., 1998, "Thermal and efficiency analysis of CO2 laser cutting process," Optics and Lasers in Engineering v 29 n 1 Jan 1998, pp. 17-32
Congradualations! You have reached the end of chapter 3, level two. Please do the following review exercise, then move on to level 3 for deeper understanding of Energy Transfer and Modleing, or go to chapter 4 for Laser Systems.
![]()
![]()